I’ve been a bit slow testing my Cormorant prototypes over the last few months. I have managed to complete the drivers for the IMU sensors and the data radio which cover most of the important hardware devices, so I thought now would be a good time to measure the power consumption. This is not just one simple number however, as Cormorant has many peripheral devices with many configurations each consuming different amounts of power.
I tested several FPGA designs and hardware configurations in order to isolate the power requirements of the individual components. Where I could, I compare theoretical numbers with what I’ve actually measured.
It’s possible to operate Cormorant as a functional flight controller with under 100mW, though this would not include any RF communication.
How I measured power consumption
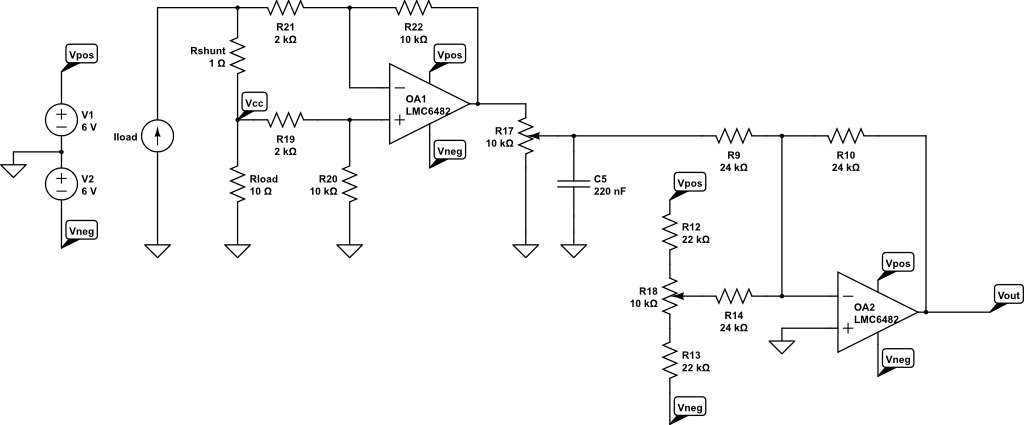
To measure the power consumption of Cormorant in its various operating modes I assembled a high-side current shunt with an amplifier out of whatever dodgy parts I already had on my shelf, as illustrated here:

The voltage drop across Rshunt is amplified ~5x, then attenuated ~2x to give an overall gain of 2.5x. The output of the amplifier is filtered with a cutoff ~300Hz before a variable offset is applied. The resulting Vout should then be 2.5mV per 1mA through Rshunt. These components are of questionable quality and temperature sensitivity, so I’ve included the two pots so I can calibrate the amplifier. In the end I found it accurate to ±2mA.
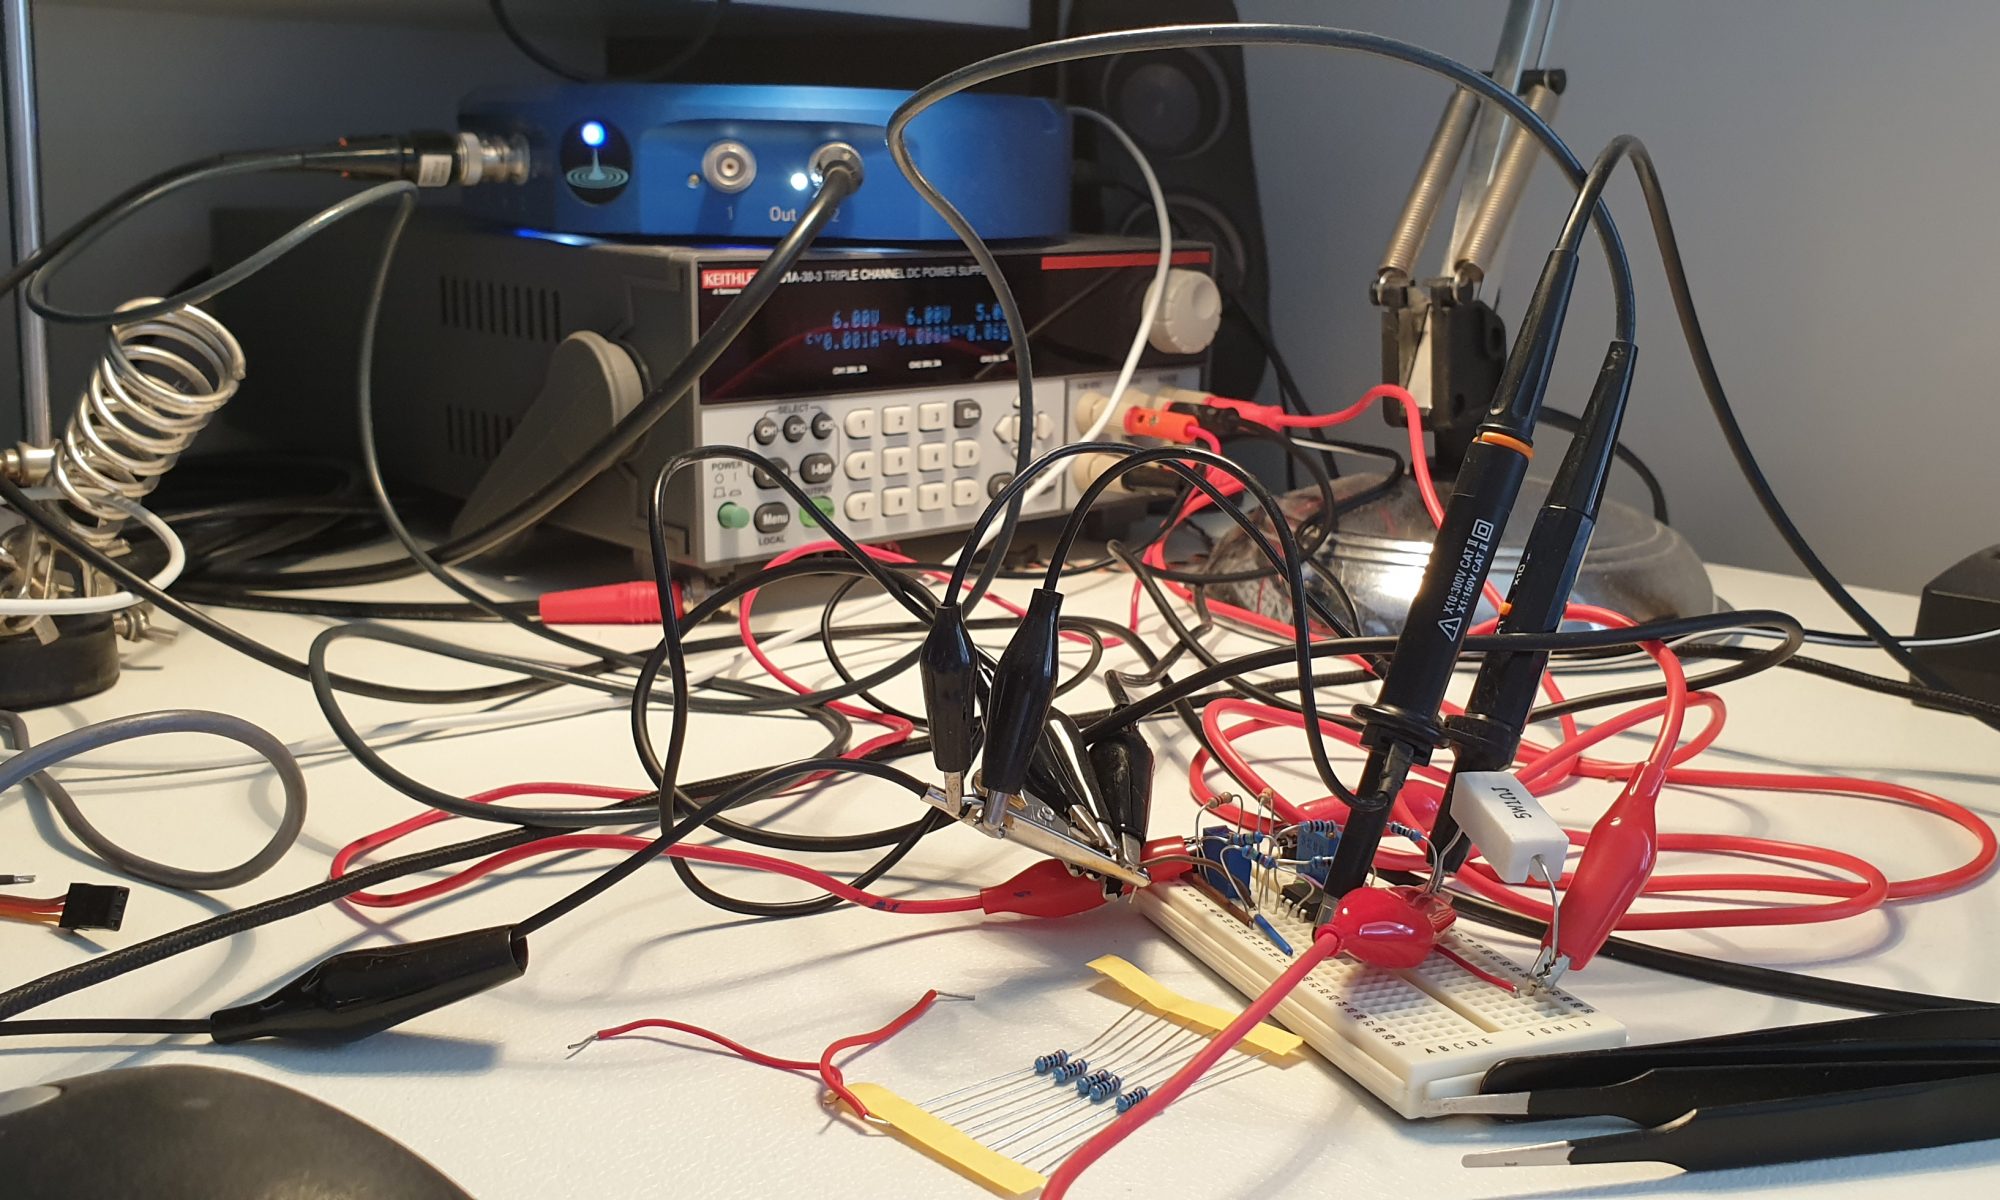
The three voltage sources were supplied by a Keithley 2231A-30-3 DC Power Supply. This supply was used as a reference for calibrating the amplifier by shorting the load and setting the current limit. The three outputs are isolated, so I can stack two on top of each other to get a negative rail.
Disclosure: I am a founder & employee of Liquid Instruments; manufacturer of the Moku:Lab.

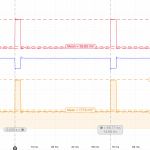
Measurement of the power supplied to the load was done by a Moku:Lab, which monitored Vcc at the load and the current via Vout, using it’s Oscilloscope instrument. The Moku:Lab’s Oscilloscope allows for a custom probe multiplier, which I set to 1/2.5 (inverse gain of the amplifier) so that the units for the current channel can be read directly as mA. Then using the maths channel (yellow) to multiply the two inputs I can read power directly in mW.
There are many configurations in which Cormorant can be used, involving different peripherals and levels of activity. I tested a sample of configurations that would try to isolate various components to quantify their power requirements individually. A design for each configuration was compiled and deployed to six devices, the power consumption of each was measured and an average established. In addition to activating peripherals, the power consumption is also increased by the dynamic resources in the FPGA; we use the vendor’s tools (Libero) to estimate this increase. Briefly, the configurations tested were:
| FPGA Design | Description | Dynamic Power (mW) |
|---|---|---|
| Erased | The FPGA was erased as it comes from the factory | – |
| Empty | The design was mostly empty, just a few default pin drivers | 0.000 |
| CPU 100MHz | The design included only the CPU with the given clock frequency. No software was loaded | 80.311 |
| CPU 140MHz | 104.569 | |
| IMU | The design configures and samples the IMU components (gyro/accel/compass/baro) in a typical configuration | 3.334 |
| Radio | The design configures and communicates over the data radio with an optional High Gain Mode (HGM). This involves packets 119 bytes long, transmitted at 15Hz. | 7.201 |
| Radio+IMU | Both radio and IMU running simultaneously | 9.713 |
These configurations were tested with and without the breakout board attached (The radio is only available on the breakout board).
There are a number of hardware configuration options enabled by jumpers on the PCB. The majority of these enable level translators to selectable voltages to drive the external headers. These are disabled on all but units 1 and 2 leading to a slight increase in power consumption on these boards.
What are the numbers?
The raw data and basic comparison plots of each design/unit combination are supplied in the attached document. From this data I was able to isolate the power consumption of individual components and activities with simple linear algebra.
| Component | Power (mW) |
|---|---|
| Cormorant | 80 |
| Breakout | 23 |
| IMU | 12 |
| CPU | 58 + 1.35/MHz |
| Radio (Active quiescent) | 44 |
| Radio TX | 309 |
| Radio TX HGM | 449 |
Comparing these results with the theoretical expectations can be done using the FPGA designs that have simple and deterministic power estimates from Libero. These are the empty design and the two CPU designs. Additionally the IMU design has simple power requirements for the peripheral devices and can also be easily compared.
| FPGA Design | Power Increase – Estimate (mW) | Power Increase – Measured (mW) | Factor (%) |
|---|---|---|---|
| CPU 100MHz | 80.331 | 192 | 42 |
| CPU 140MHz | 104.569 | 246 | 43 |
| IMU | 2.106+3.334 | 12 | 45 |
So what does this mean?
The original design of Cormorant was aiming to control an aircraft with under 100mW. These results show that this is possible, just, with a minimal configuration that doesn’t include any RF communication. In this configuration we would have inertial sensors and computation capabilities (FPGA only, no CPU). Of course this doesn’t include the actuators required to control the aircraft. A more typical configuration would include the breakout board with the radio transmitting and is likely to require 160mW minimum and 470mW during transmit.
The measured power consumption was significantly higher than the theoretical expectation, however in the cases we can directly compare there is a consistent factor in this error. This is likely the efficiency of the switch mode power supplies used in the design. This efficiency factor was expected to be ~80% at the given current output, not the ~43% we’re observing. This will need to be confirmed with further experimentation.
Power consumption during radio transmission was also significantly lower than expected. In high gain mode, the output power is expected to be just under 27dBm, and the power draw of the amplifier alone should be ~1W. In experimentation, increasing the signal amplitude into the amplifier can increase power consumption, but I need to actually isolate where the power is missing.


